⚡️ A unique approach, official data

Learn how to read

institutional positioning on CME

Learn how to read institutional positioning on CME

Course participants photos

27 traders are taking the course right now

Coinbase logoICE logoCFTC logoCME Group logoCboe logoNymex logoNasdaq logoCBOT logo

COT reports provide

a real understanding of the market

vector decorative shape

Official data from the US regulator

The reports are published by the CFTC – an independent U.S. government agency that regulates the futures, options, and swaps markets.

vector decorative shape

Positions of institutional players

The reports include the positions of banks, funds, producers, corporations and other institutions that actually move the market

BlackRock logoJ.P.Morgan logoBank of America logoVanguard logo
vector decorative shape

Published weekly

The data is updated regularly, so it lets you see shifts in positioning before key moves

This course is a fit for

arrow icon
Beginners

Those who want to master a professional approach to the financial markets and start working with them fully

arrow icon
Traders

Those who are tired of analyzing dry and chaotic charts and want a deeper understanding of the market

arrow icon
Experienced

Those who want to complement their strategy with an understanding of the market's macroeconomic context by analyzing what large financial institutions do and which positions they hold

arrow icon
Investors

Those who want to increase returns by tracking the positions of large funds and banks in order to catch market trends more precisely and take profit in time
What the course

includes?

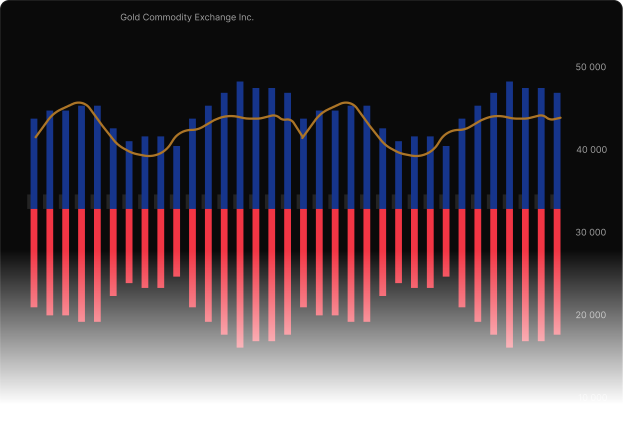
2 working files

Unique files that collect and aggregate the positions of financial institutions into a convenient format and build metrics that let you effectively analyze smart money positioning in the financial markets

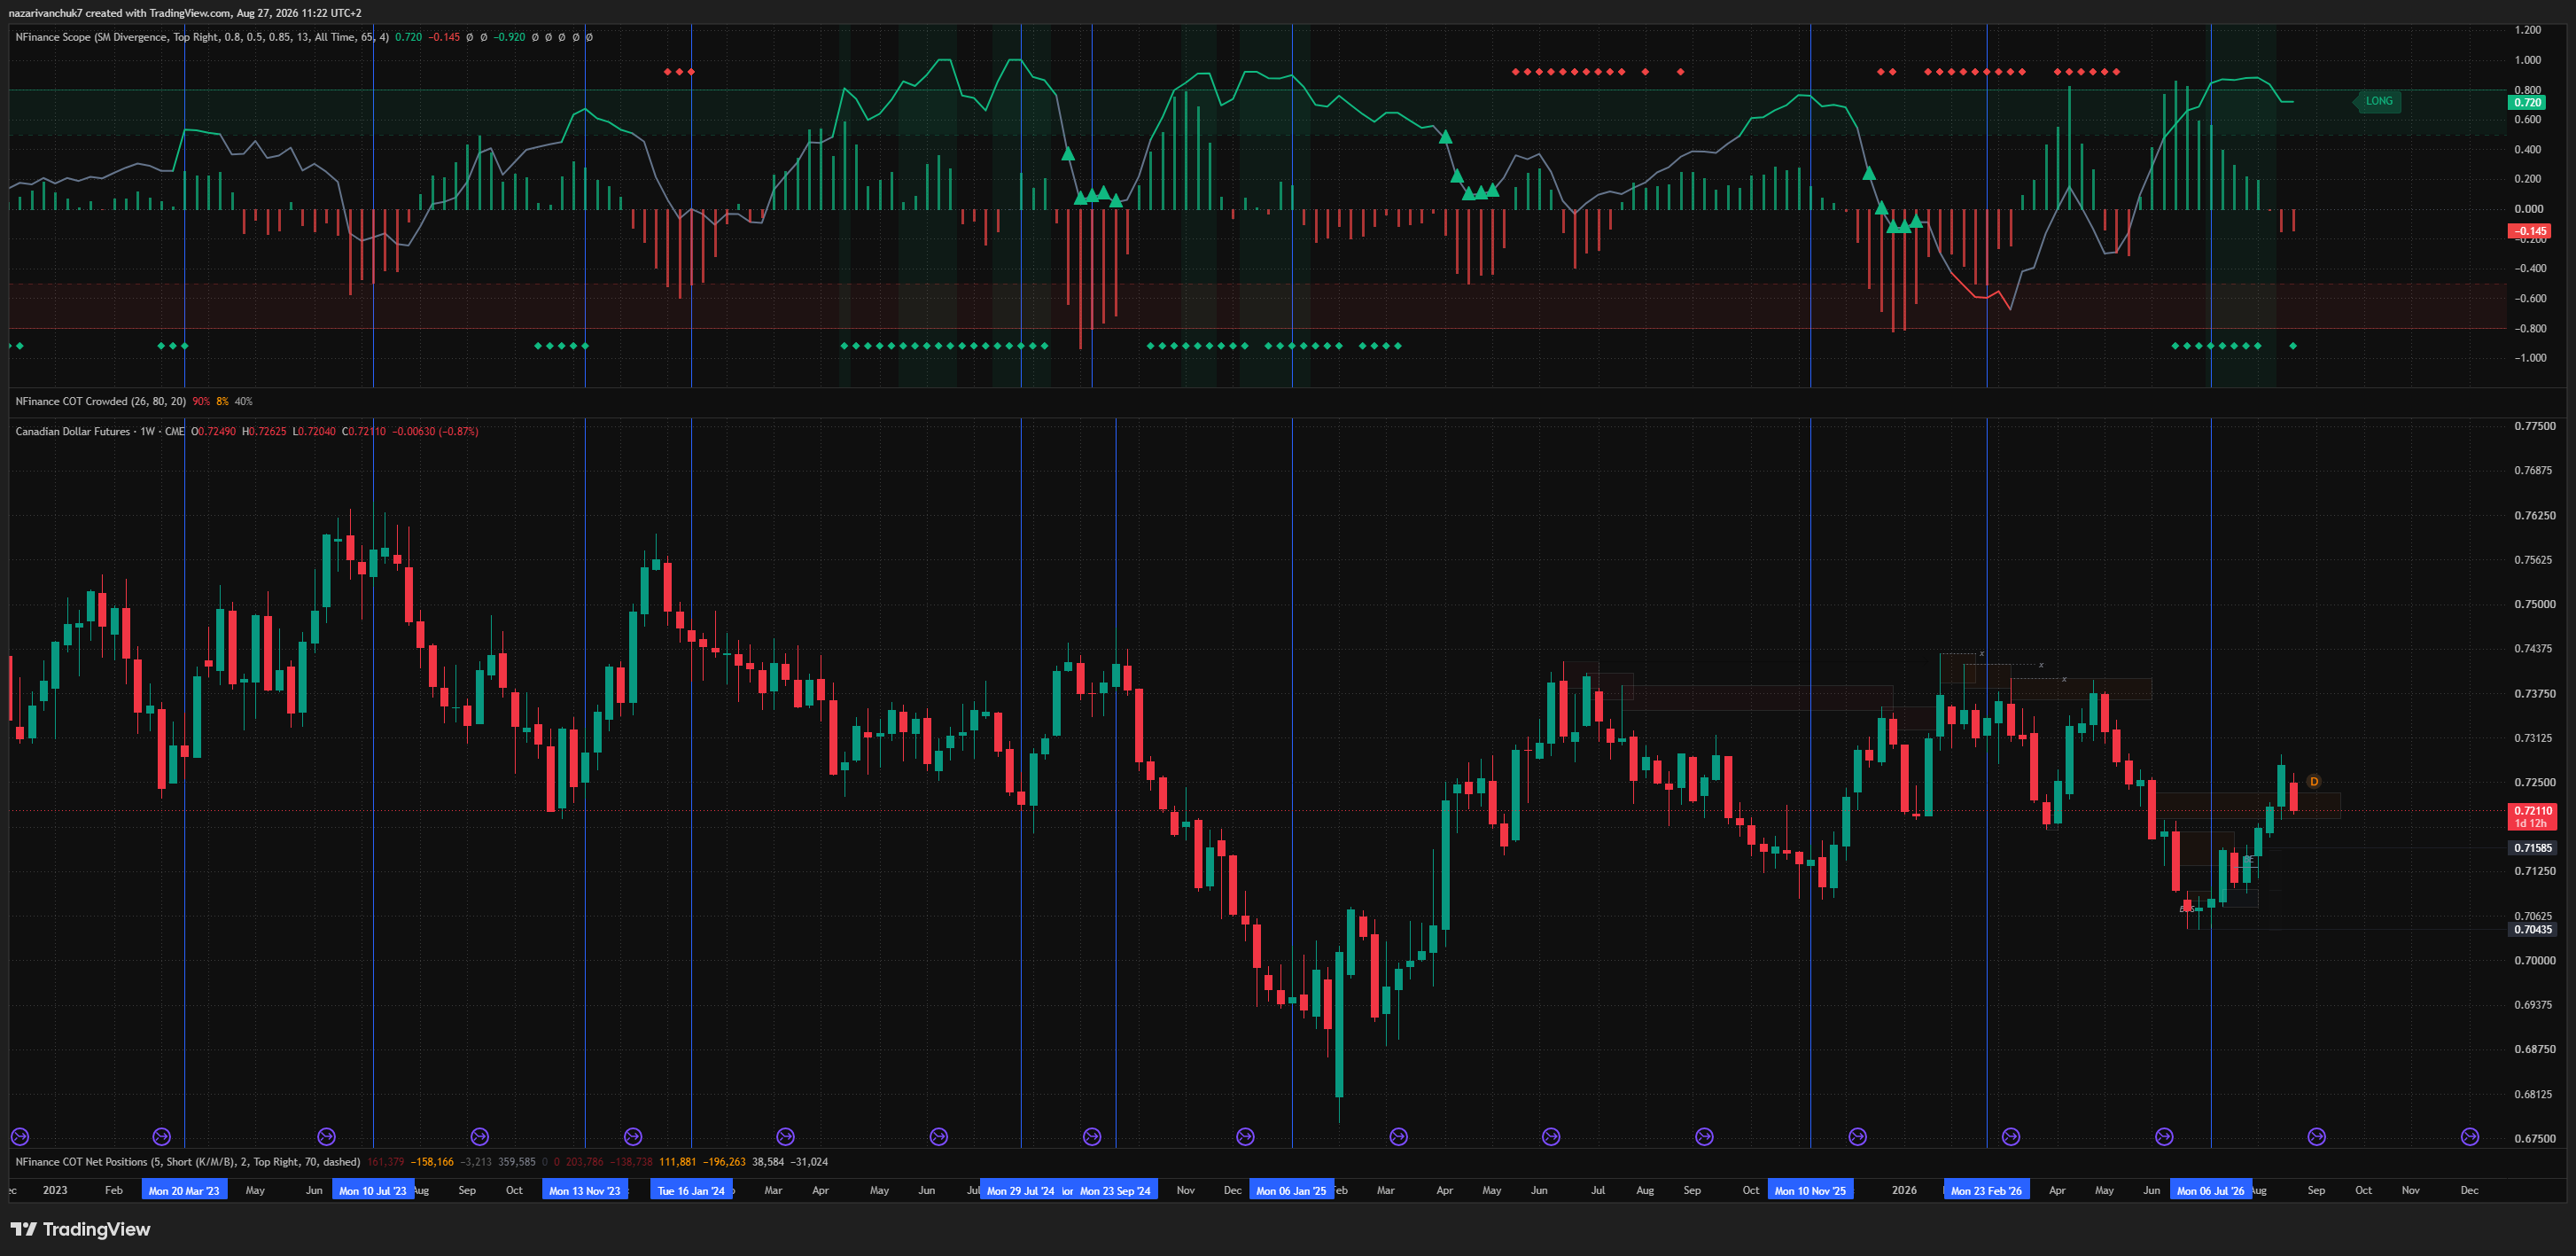
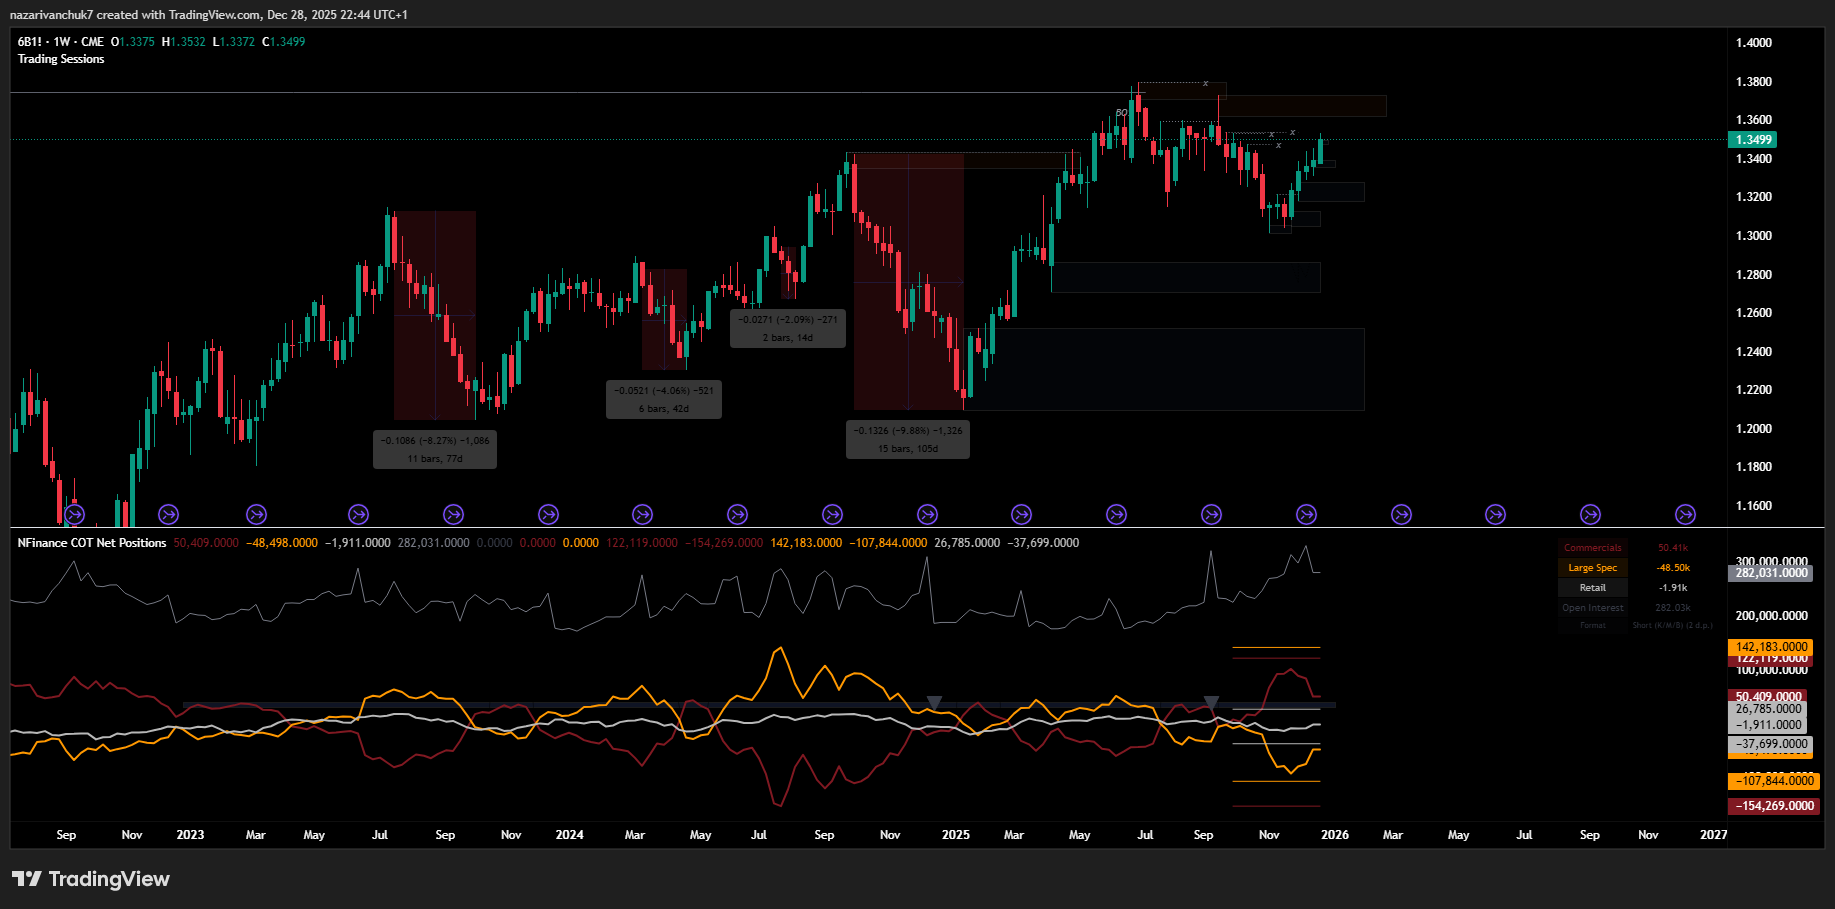
trading chart with COT data

34+ training videos

The course explains the logic of working with official data from the U.S. Commodity Futures Trading Commission, walks through the structure of the data, the specifics of each market participant group across different asset classes, the principles of analyzing and understanding their positions, and also building working files for analytics

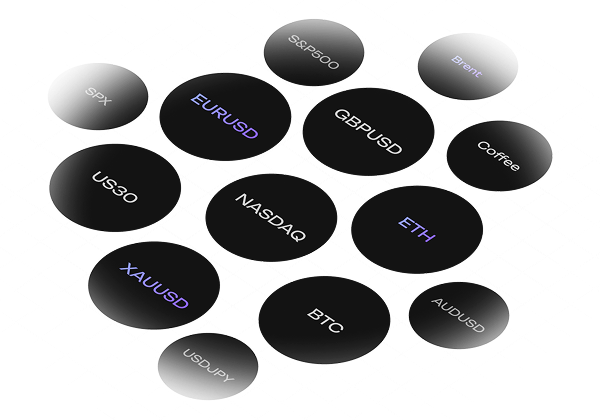
40+ assets

The analysis covers the main markets: FX, indices, metals, commodities, crypto. The work examines dozens of instruments and how large players are positioned in each of them

Assets list image

5+ custom private indicators

Proprietary indicators built on CFTC data and smart money positioning metrics: NFinance Seasonality, NFinance Macro Relative Index, NFinance Net Positions, NFinance Index and NFinance Scope (for the Forex market)

More about the indicators

Private Discord channel

A private ecosystem aimed at your personal growth and at improving your working skills

What's inside?

Homework

Practical tasks after each lesson to reinforce your skills in working with COT data

NFIF.PRO | COT&Macro Platform

The most informative COT&Macro platform on the market, fully covering your need for the macro picture and institutional positioning.

Case studies

using the reports

case chart example
Course author photo
Nazar

course author

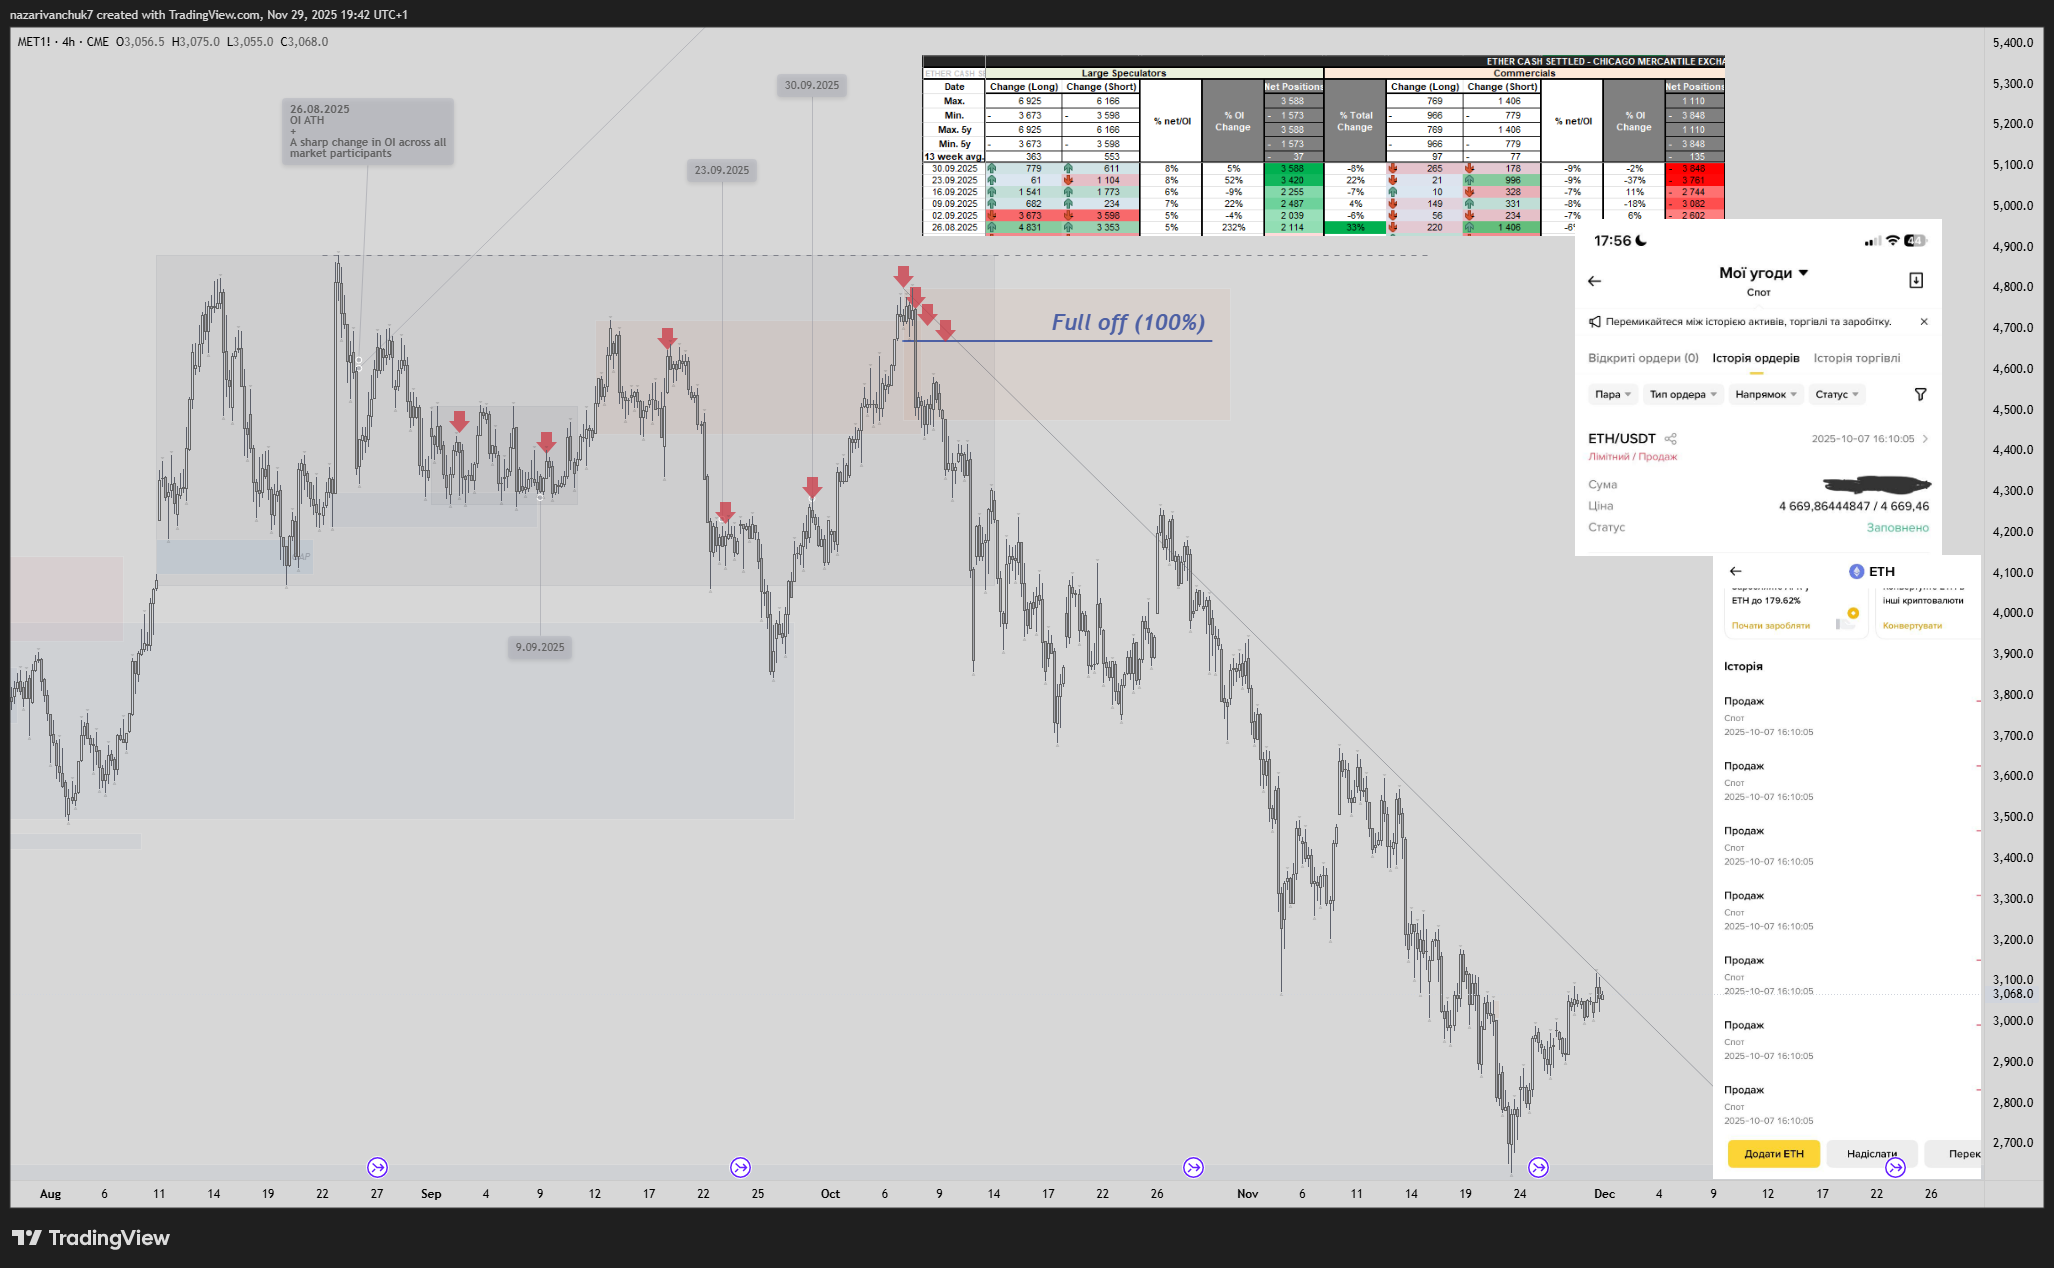
Full close of the spot ETH portfolio before the correction

Institutions shifted their positioning very sharply in the week when ETH was at its very peak. Even though ether kept rising in price, the reports showed that institutions were exiting it, and later they built the largest number of shorts in history. The full close across all assets happened on 7.10.2025 after a structural break. A few days later we saw a strong drop and the largest number of liquidations in history. The reports again ran ahead of the chart, showing institutions leaving the market.

View the breakdown

case chart example
Course author photo
Nazar

course author

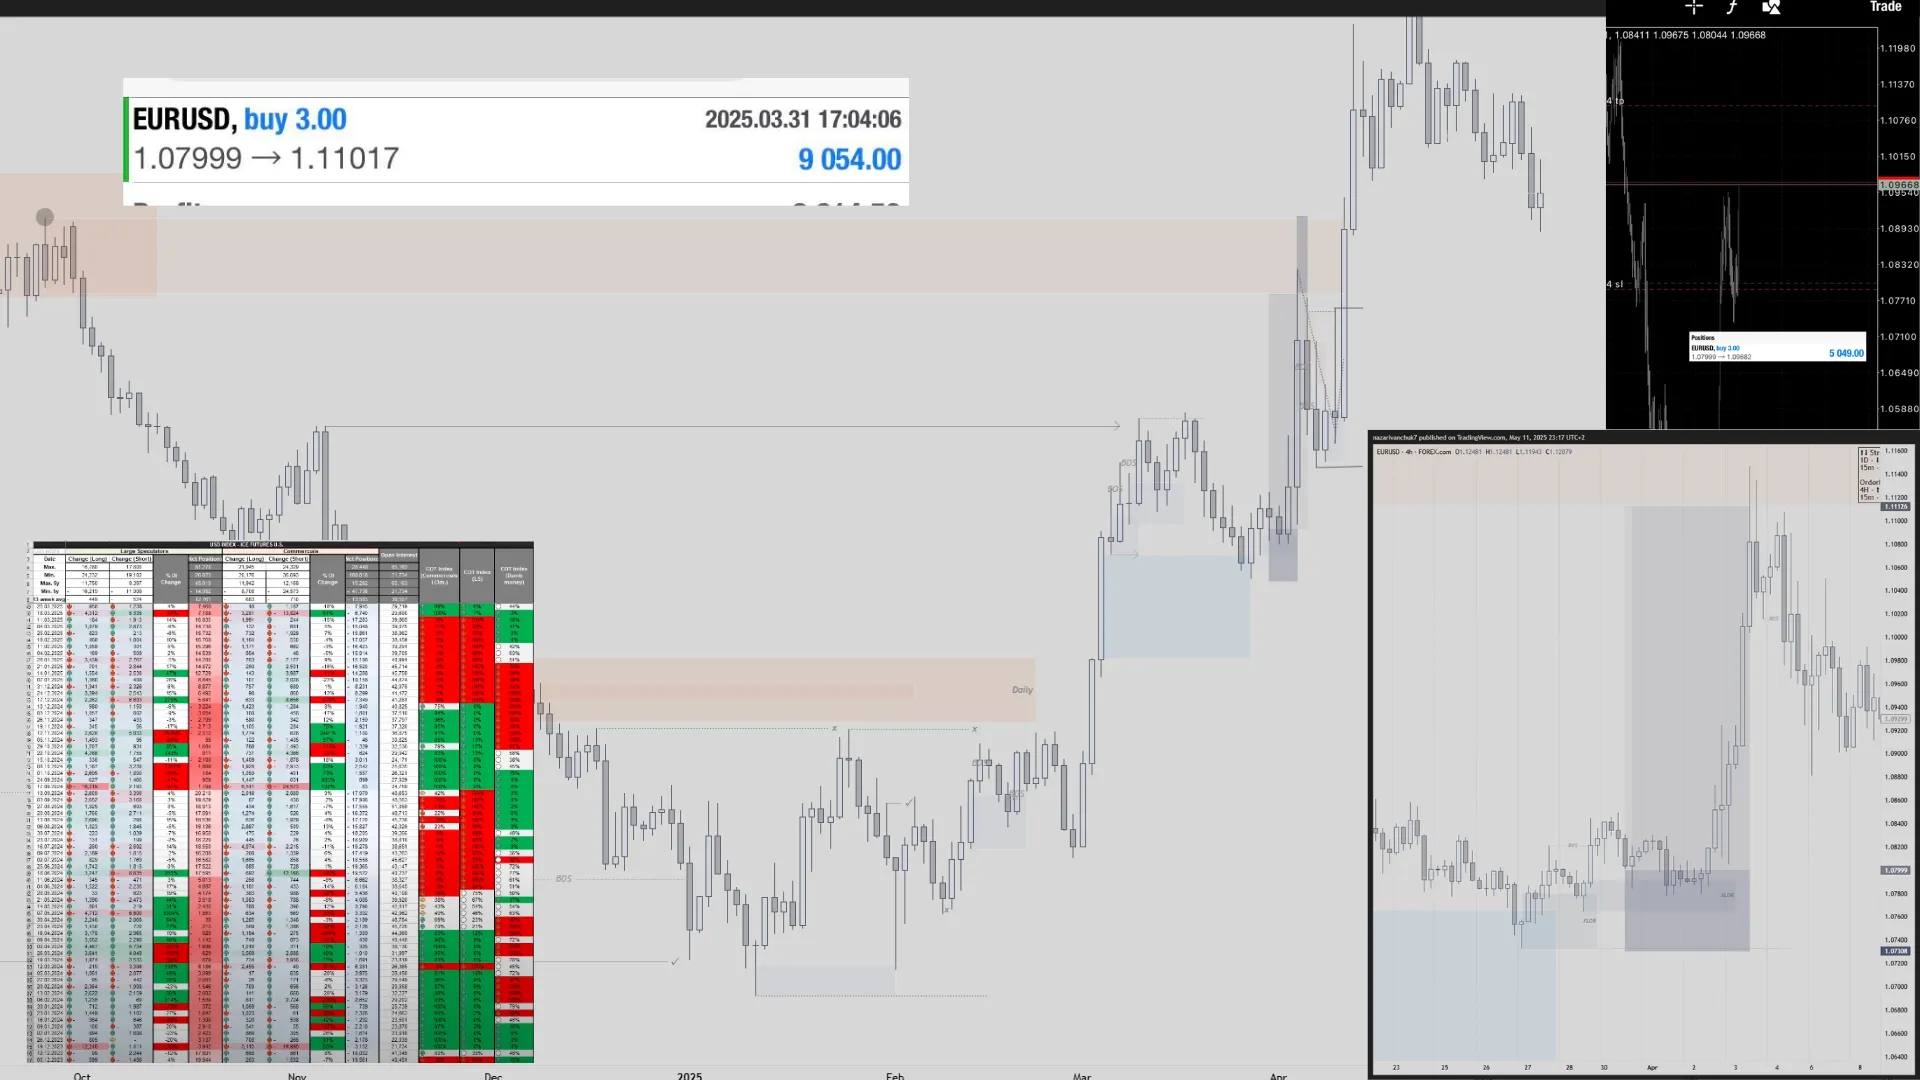
Identifying the narrative on EUR/USD and playing out the idea for +9k

Funds were offloading their dollar positions, and this was very clearly visible in the reports. Commercial companies were doing the same, which technically also coincided with a supply zone on the chart. On the euro, the reports showed a continued build-up of longs, where earlier they had accumulated positions from shorts into longs within the range at the start of the year. Commercial companies were hedging on the euro. After demand zones and support formed on the demand side, this created an opportunity to play out the long scenario.

View the breakdown

case chart example
Course author photo
Nazar

course author

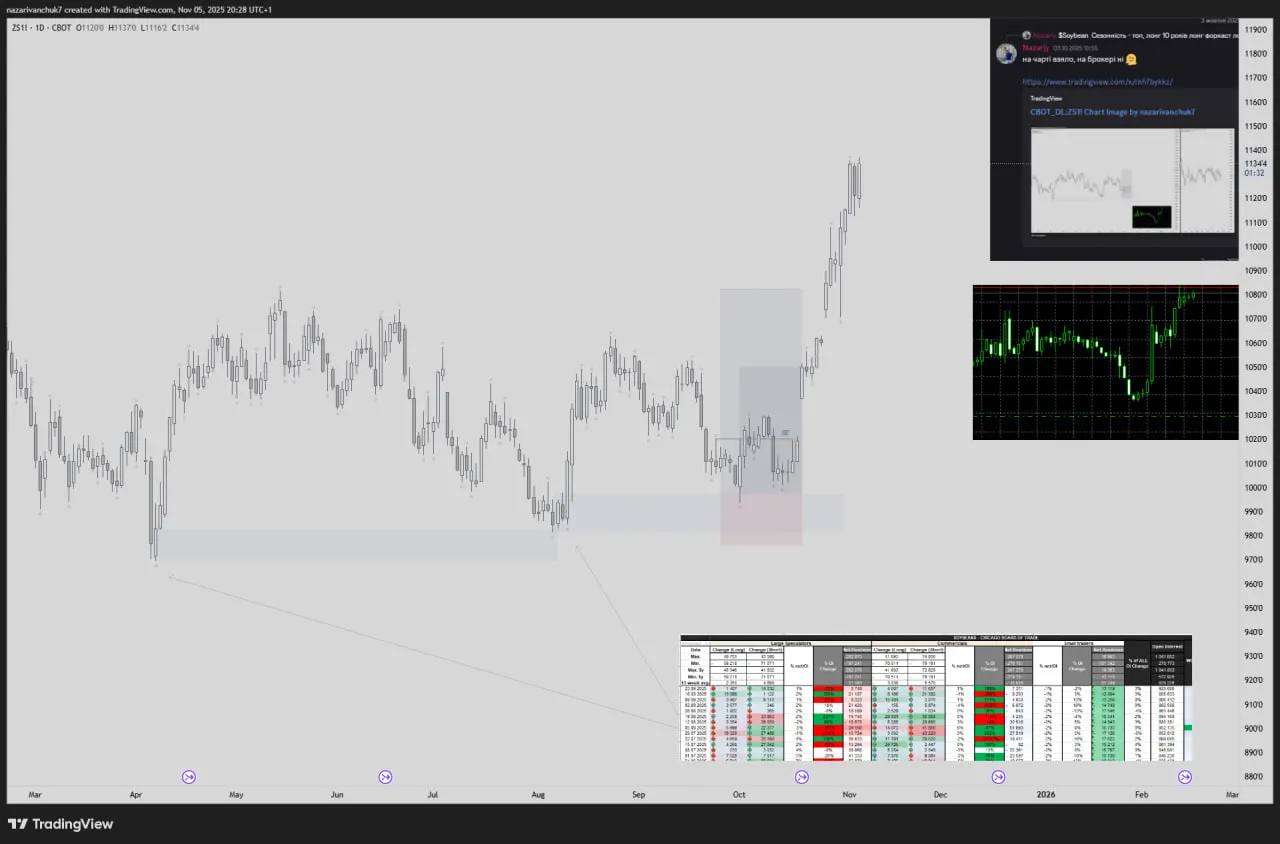
$Soybean - how the long scenario was identified

In early August the price reached the April extreme of the Demand zone, where there had already been volume before. This is clearly visible on the chart + in the reports. On 19.08 there was a sharp change in institutions' positions, where they flipped into long positions. Commercials started hedging. Positions grew every week, except the last week! When they reduced positions, but the total open interest on the CME rose and on the whole had been showing positive dynamics before that. Which meant the asset was being bought into. Technically, the highlighted demand zone was the last one, which could potentially give an upward impulse for continuation, considering that reactions had already occurred at such prices before.Seasonality indicator - Long!Macro assessment of the asset - Long!

View the breakdown

case chart example
Course author photo
Nazar

course author

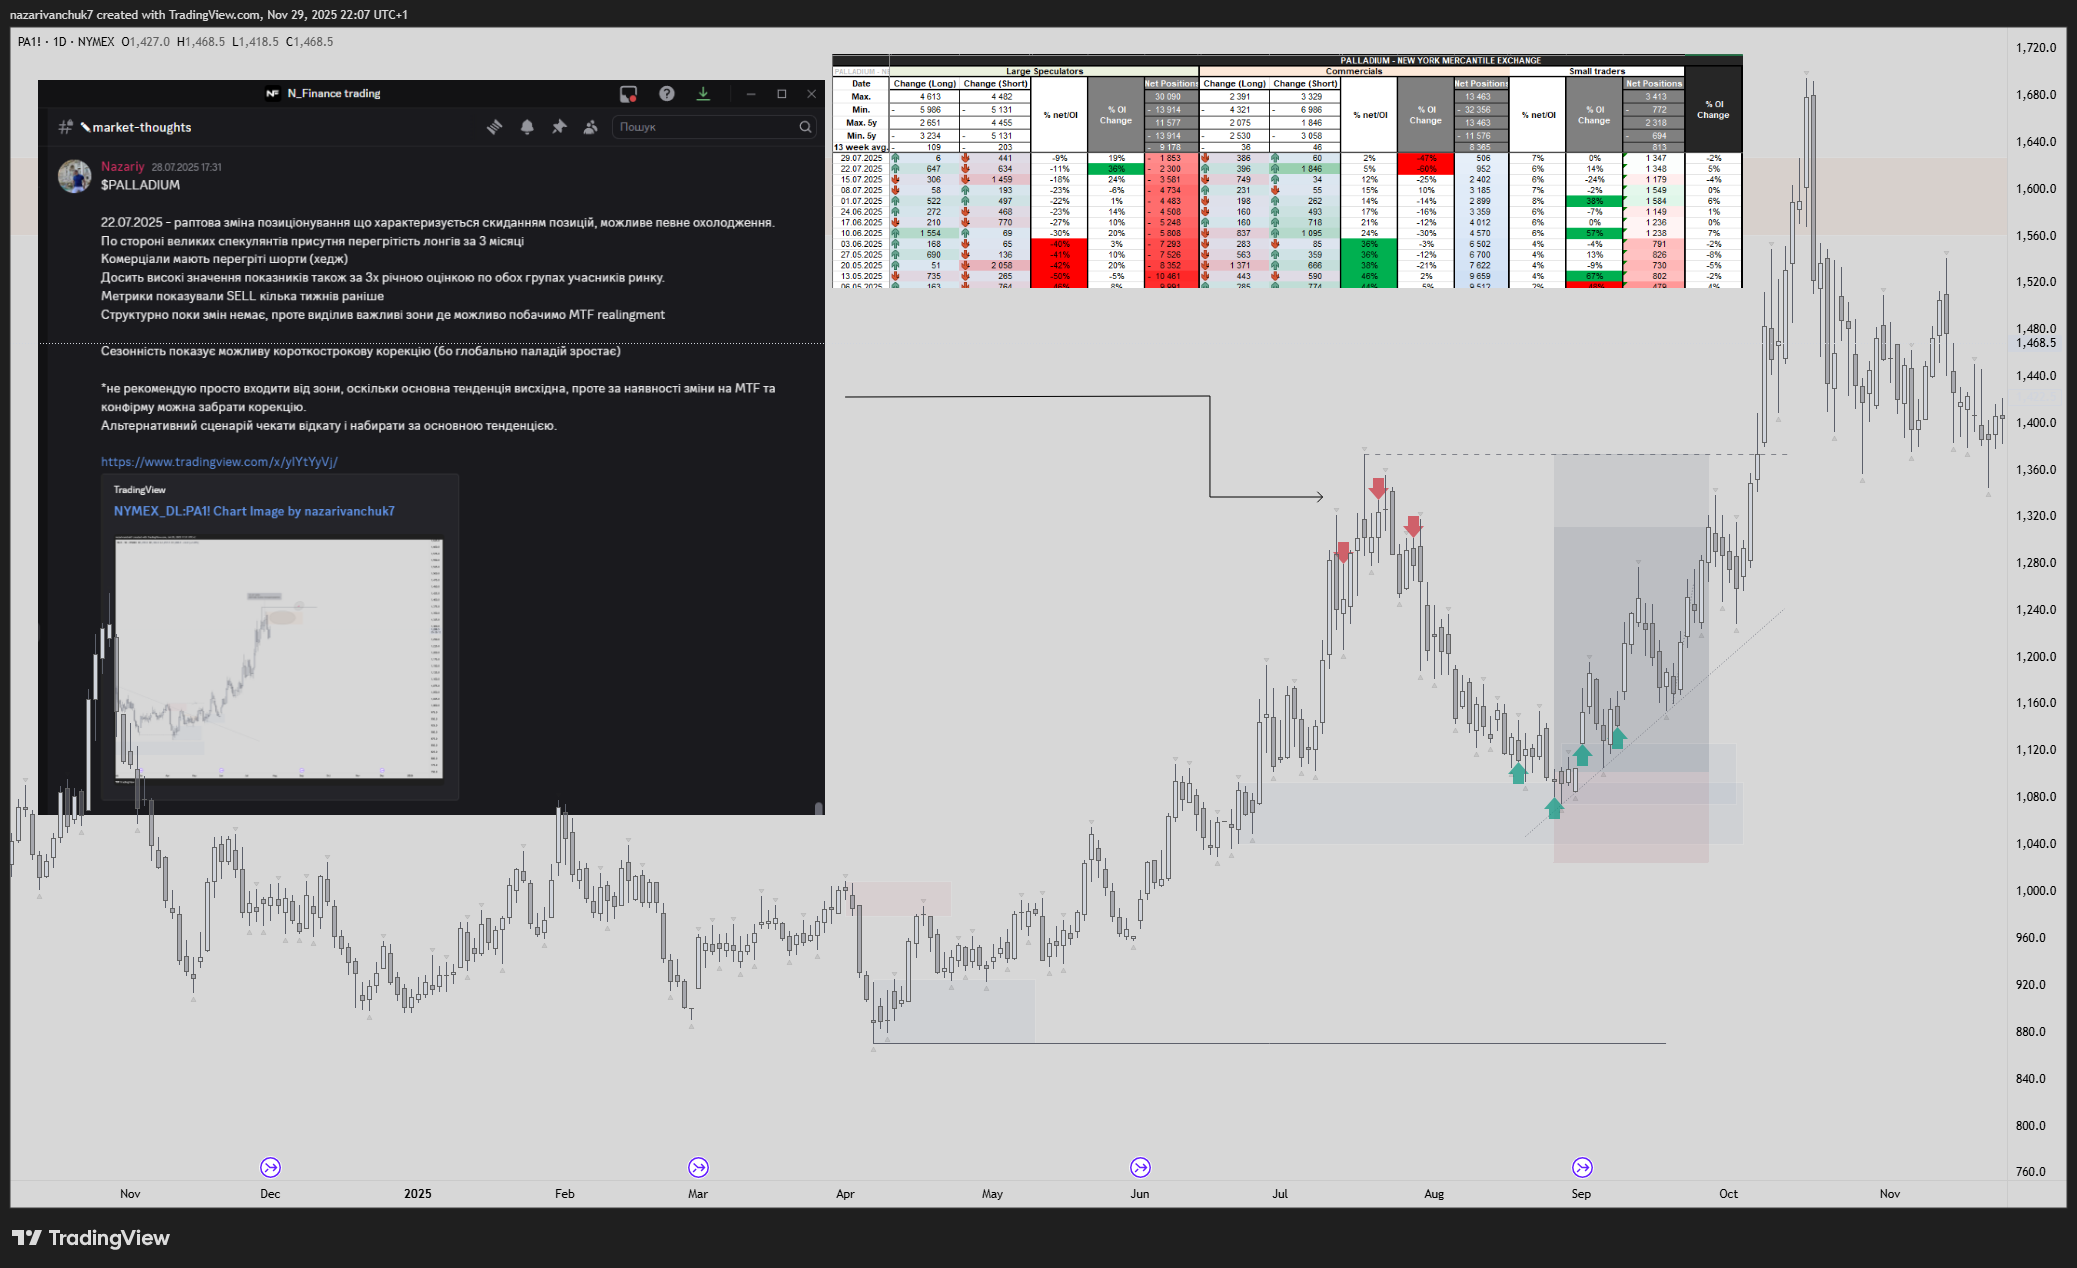
Palladium positioning reversal and continuation long

Palladium | 28.07.2025 | Discord | Institutions are sharply offloading positions22.07.2025 - a sudden change in positioning characterized by offloading of positions, some cooling-off is possible. On the large speculators' side there is an overheating of longs over 3 months Commercials have overheated shorts (hedge). Fairly high readings also on a 3-year assessment for both groups of market participants. The metrics had shown SELL a few weeks earlier. There were no structural changes, but there was a strong chance of seeing an MTF realignment toward continuation of the main trend. Institutions gave a signal for the asset to cool off and for entry at better prices. Seasonality also showed a potential short-term correction.

View the breakdown

trading chart
Course author photo
Nazar

course author

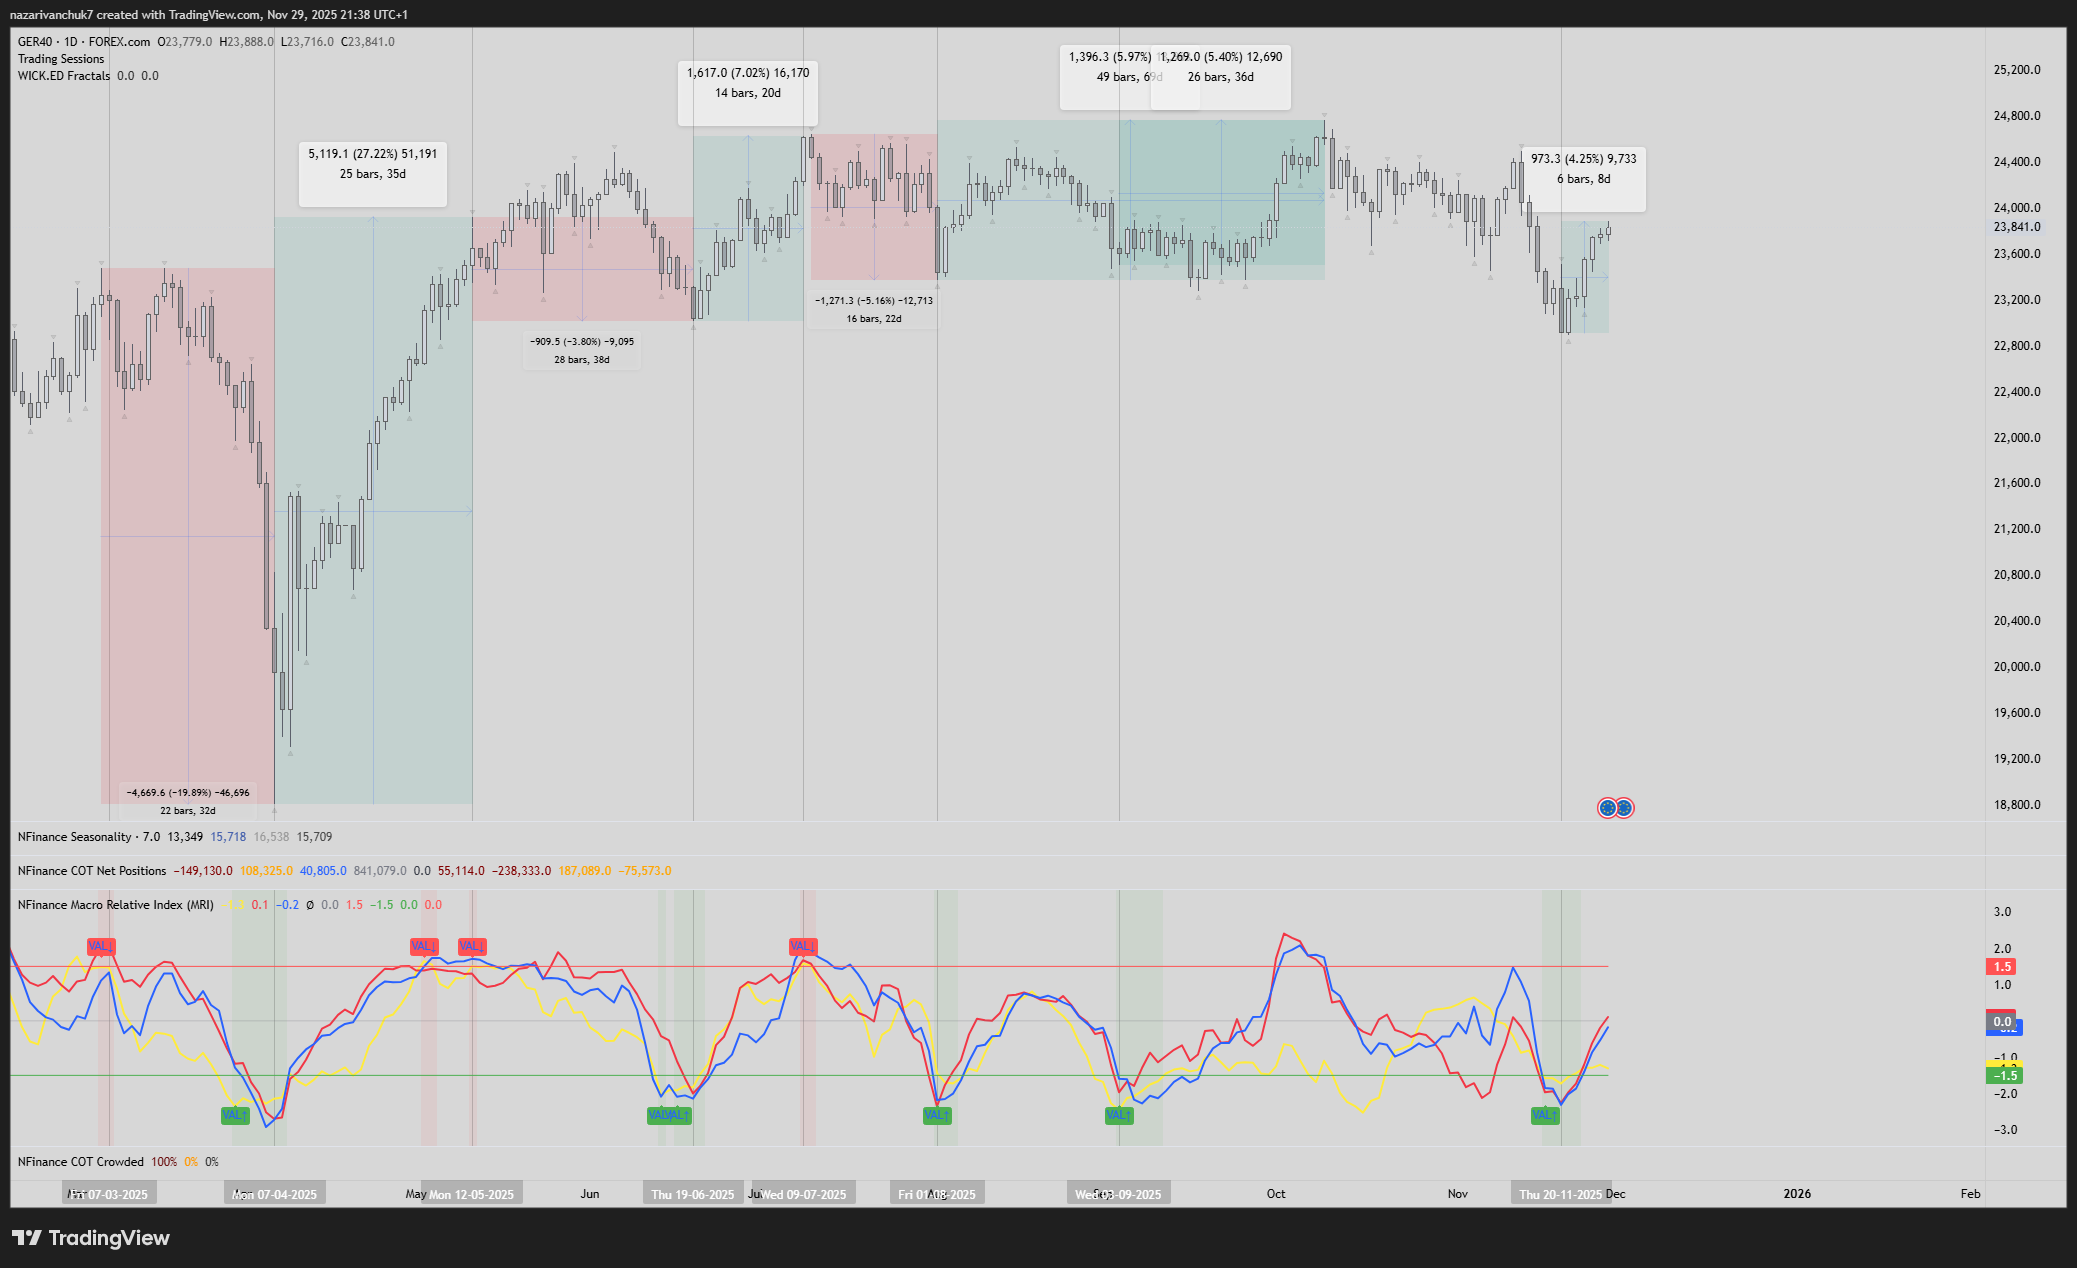
NFinance Macro Relative Index (MRI)

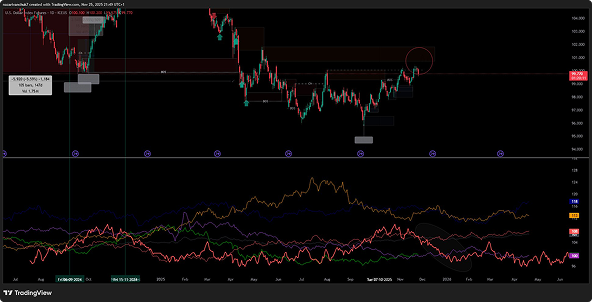
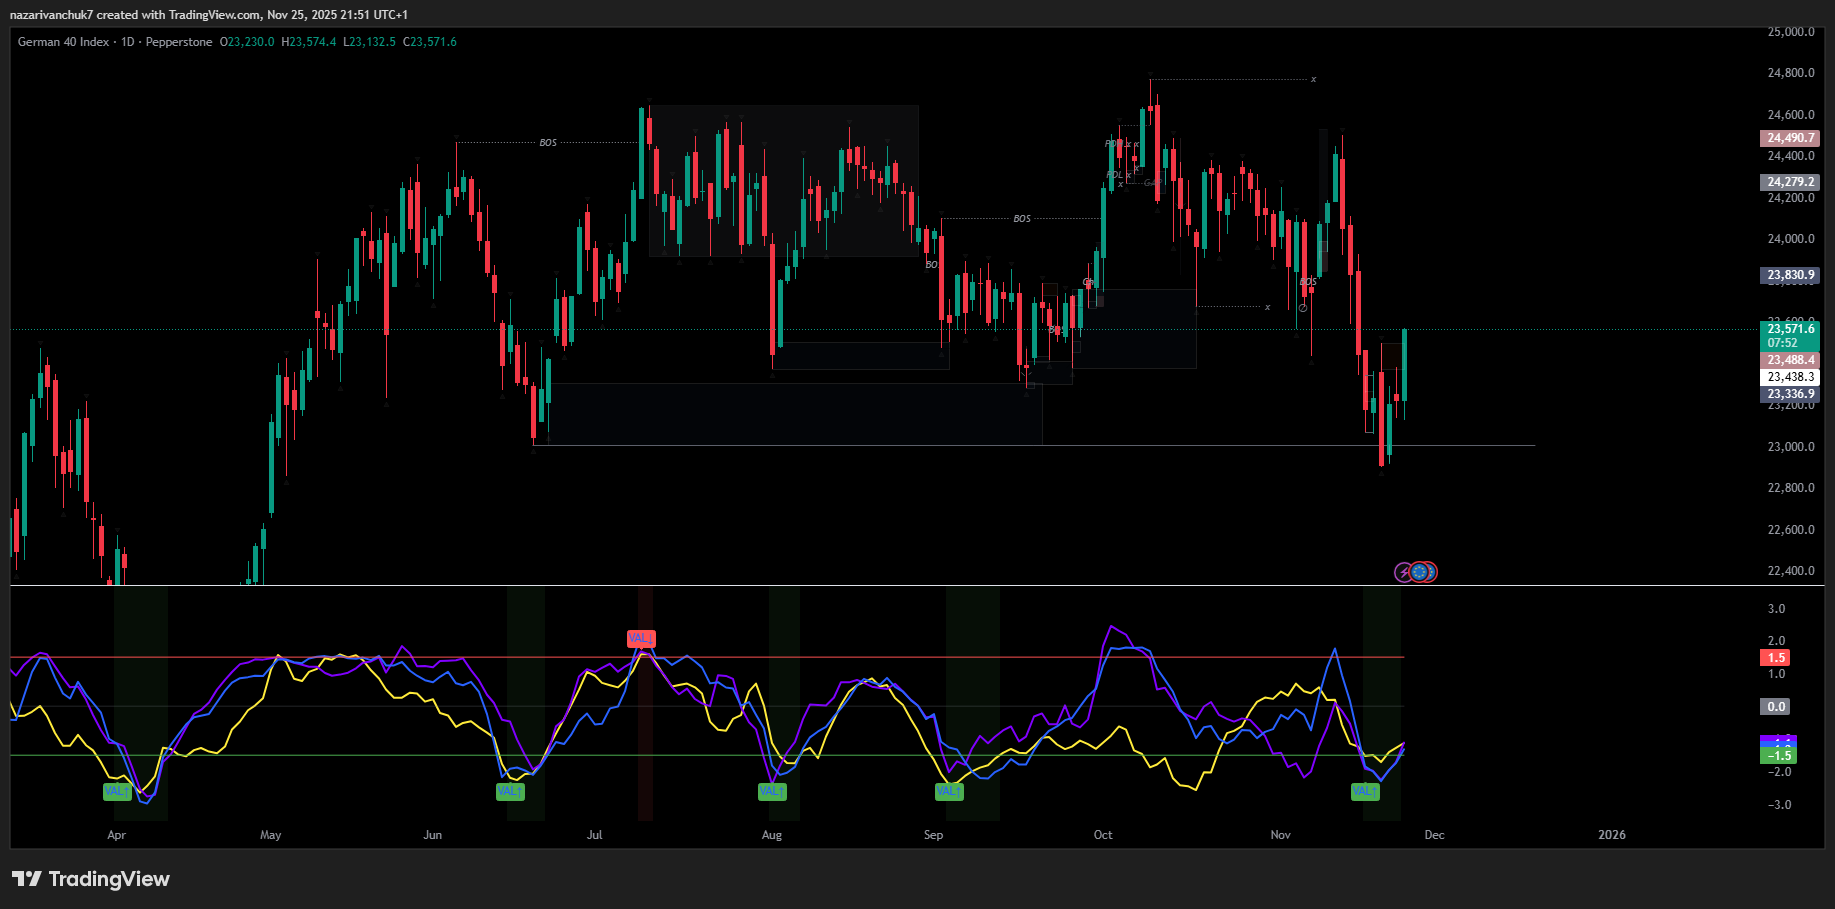
A clear example of how the metric works, which performs an assessment of the asset's macro-fundamental positioning relative to the main assets on the market: gold, the dollar and US bonds. Moments of undervaluation and overvaluation give an understanding of the long-short narrative. Green shows when the asset is undervalued and points to buying, red points to overvaluation and points to a potential sale of the asset. Used as a supporting factor in decision-making in combination with the reports.

View the breakdown

Rice — swing position from COT reports
2 photos
Course author photo
Nazar

course author

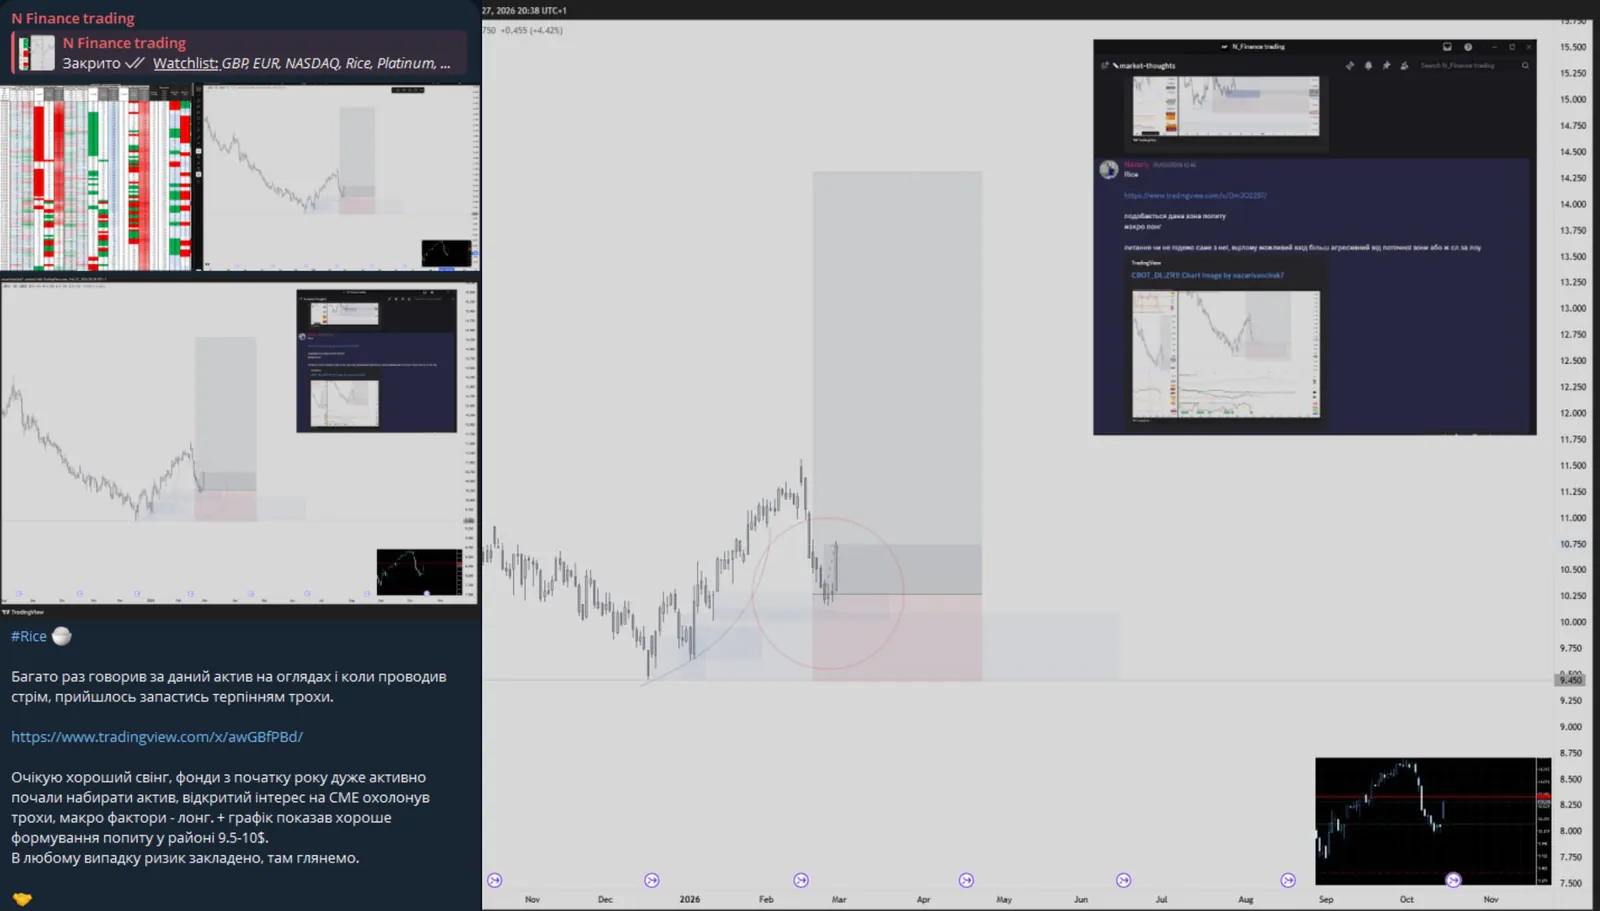
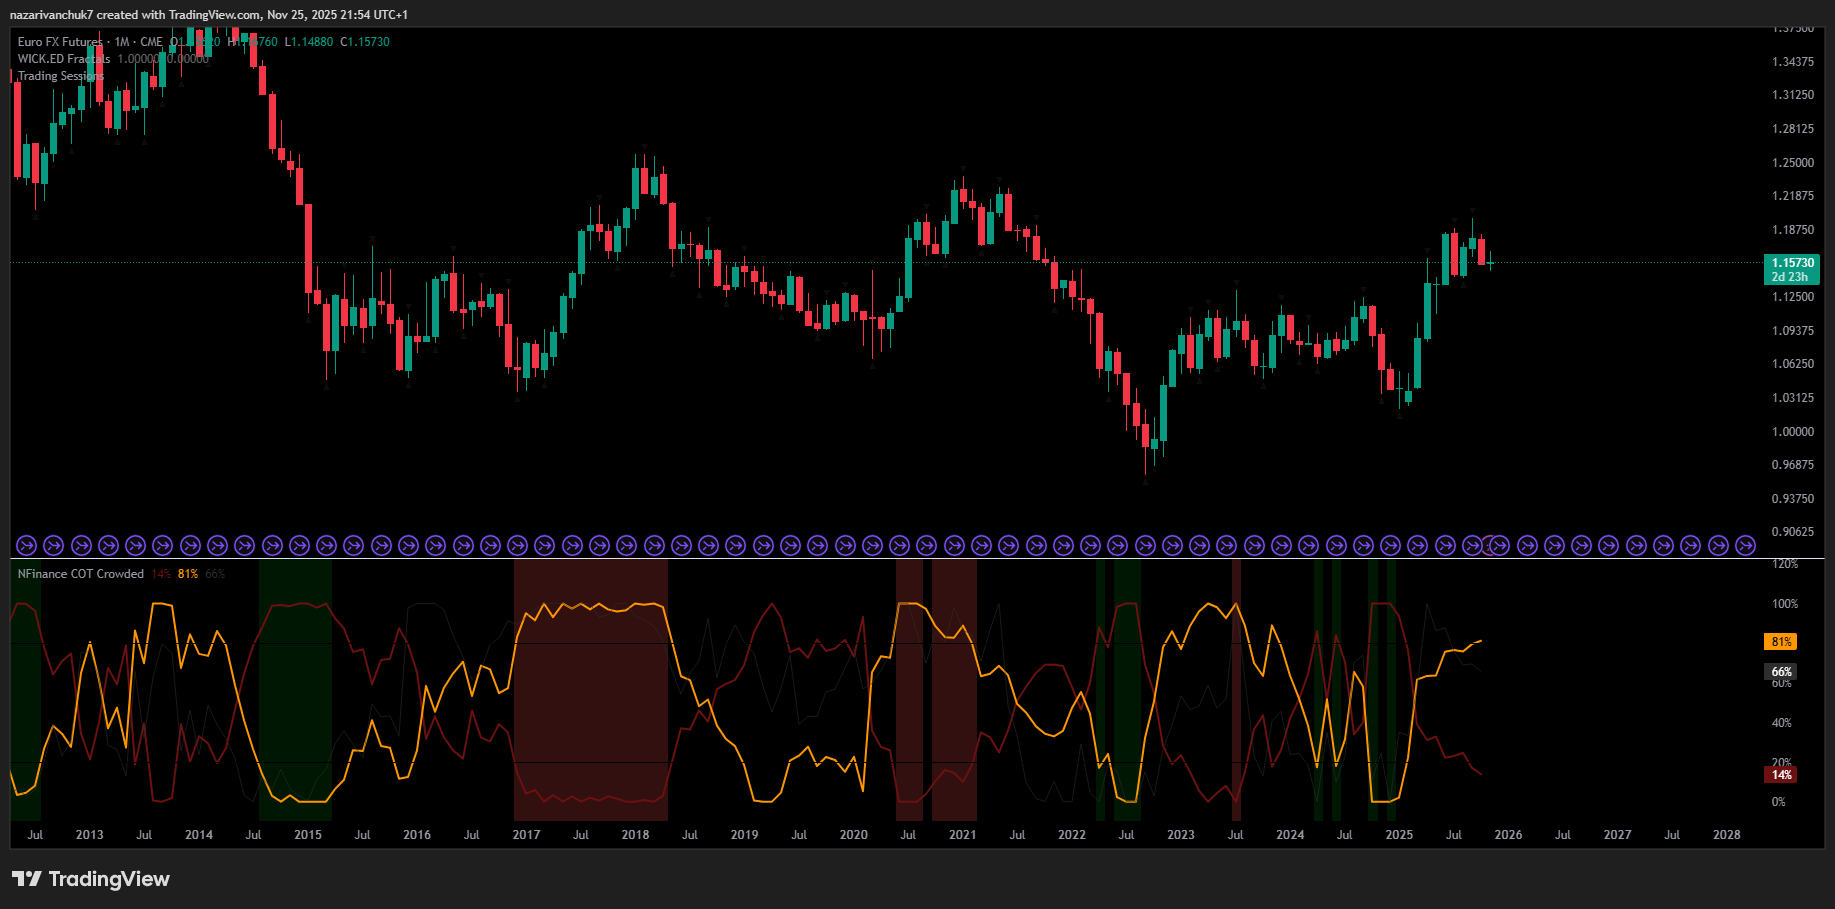
Rice — swing position from COT reports

Funds have held shorts for 4 weeks, producers are loaded into hedge longs at 88% — close to the all-time record.
View the breakdown

Brent — a convergence of technical and fundamental factors
2 photos
Course author photo
Nazar

course author

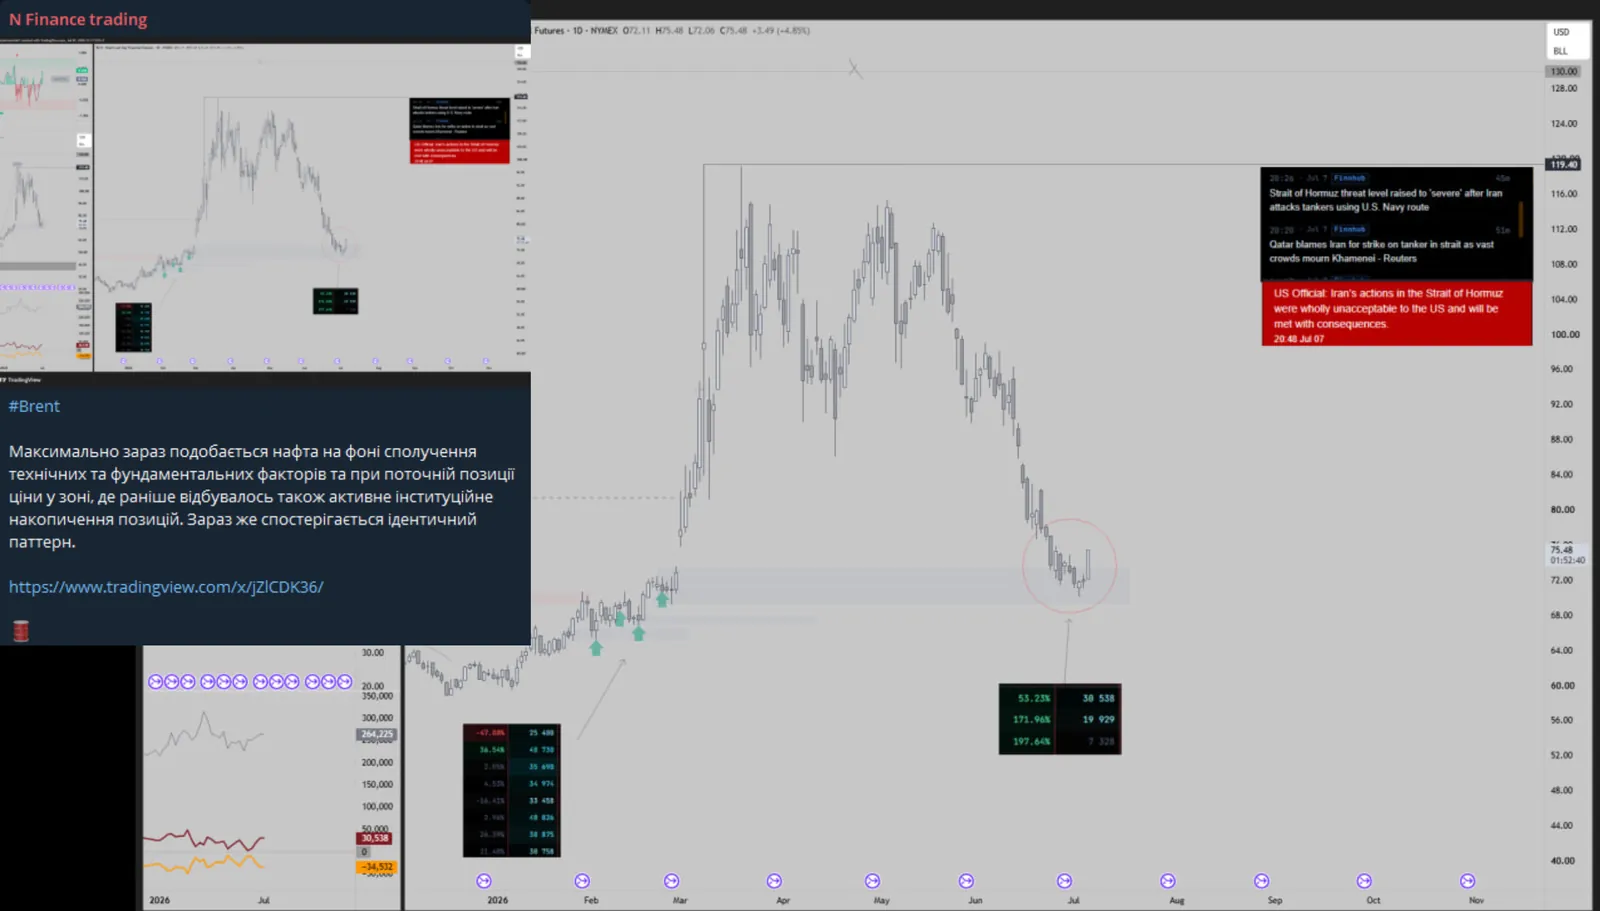
Brent — a convergence of technical and fundamental factors

Price is in a zone where there was active institutional accumulation before. Now — an identical pattern.

View the breakdown

JPY — the full trade story from COT reports
2 photos
Course author photo
Nazar

course author

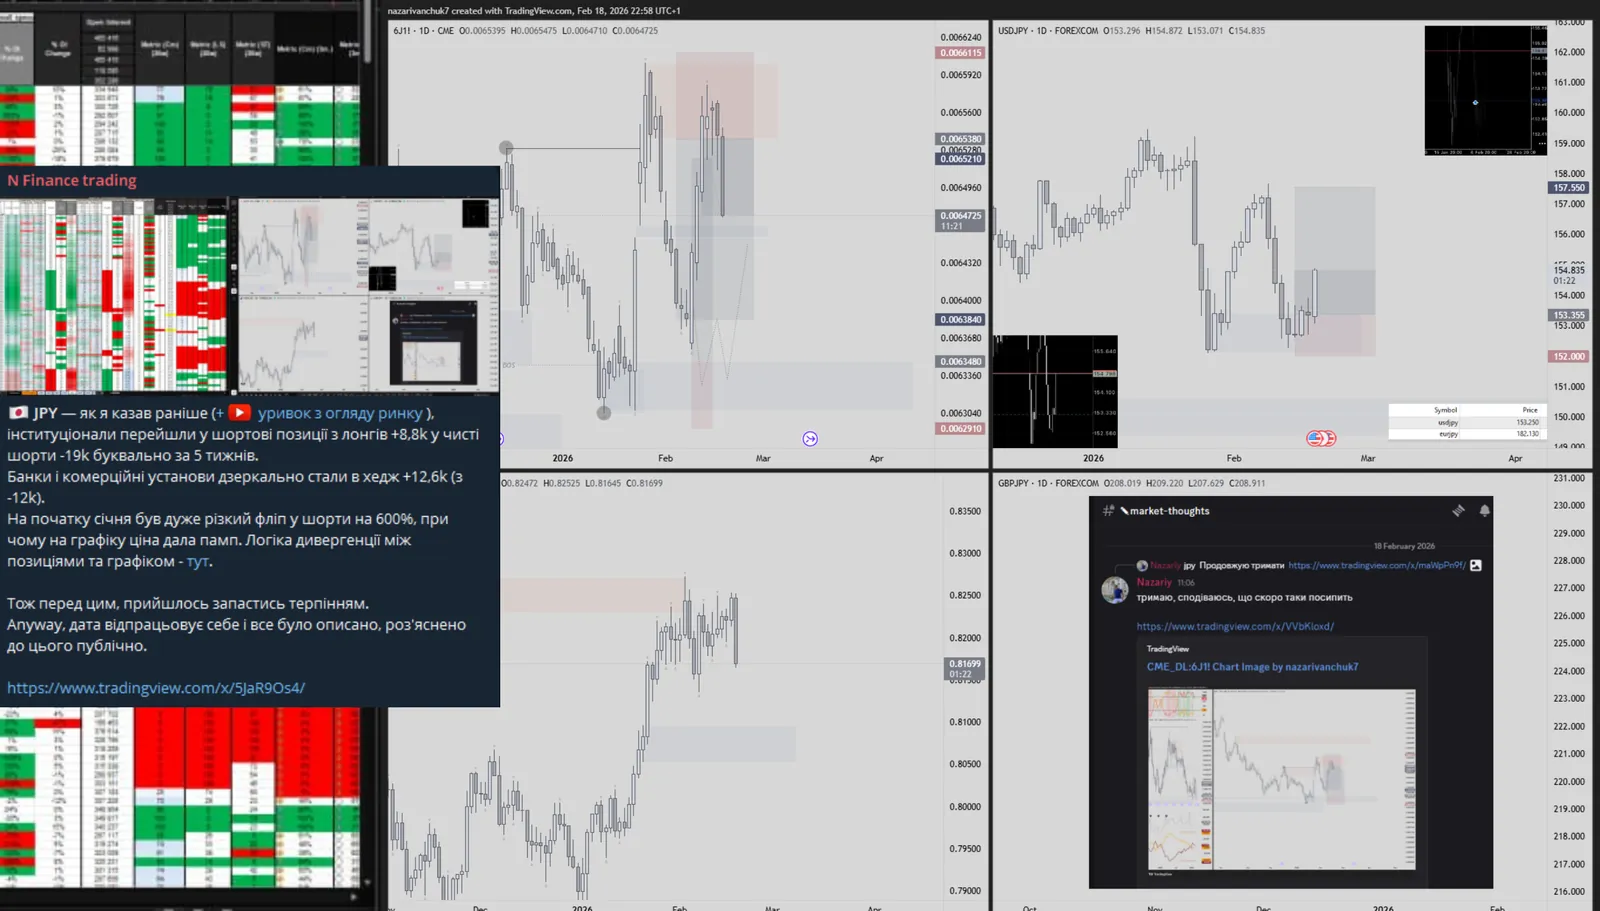
JPY — the full trade story from COT reports

Over 5 weeks institutionals moved from +8.8k longs to net shorts of −19k. Banks — mirror-image into the hedge.

View the breakdown

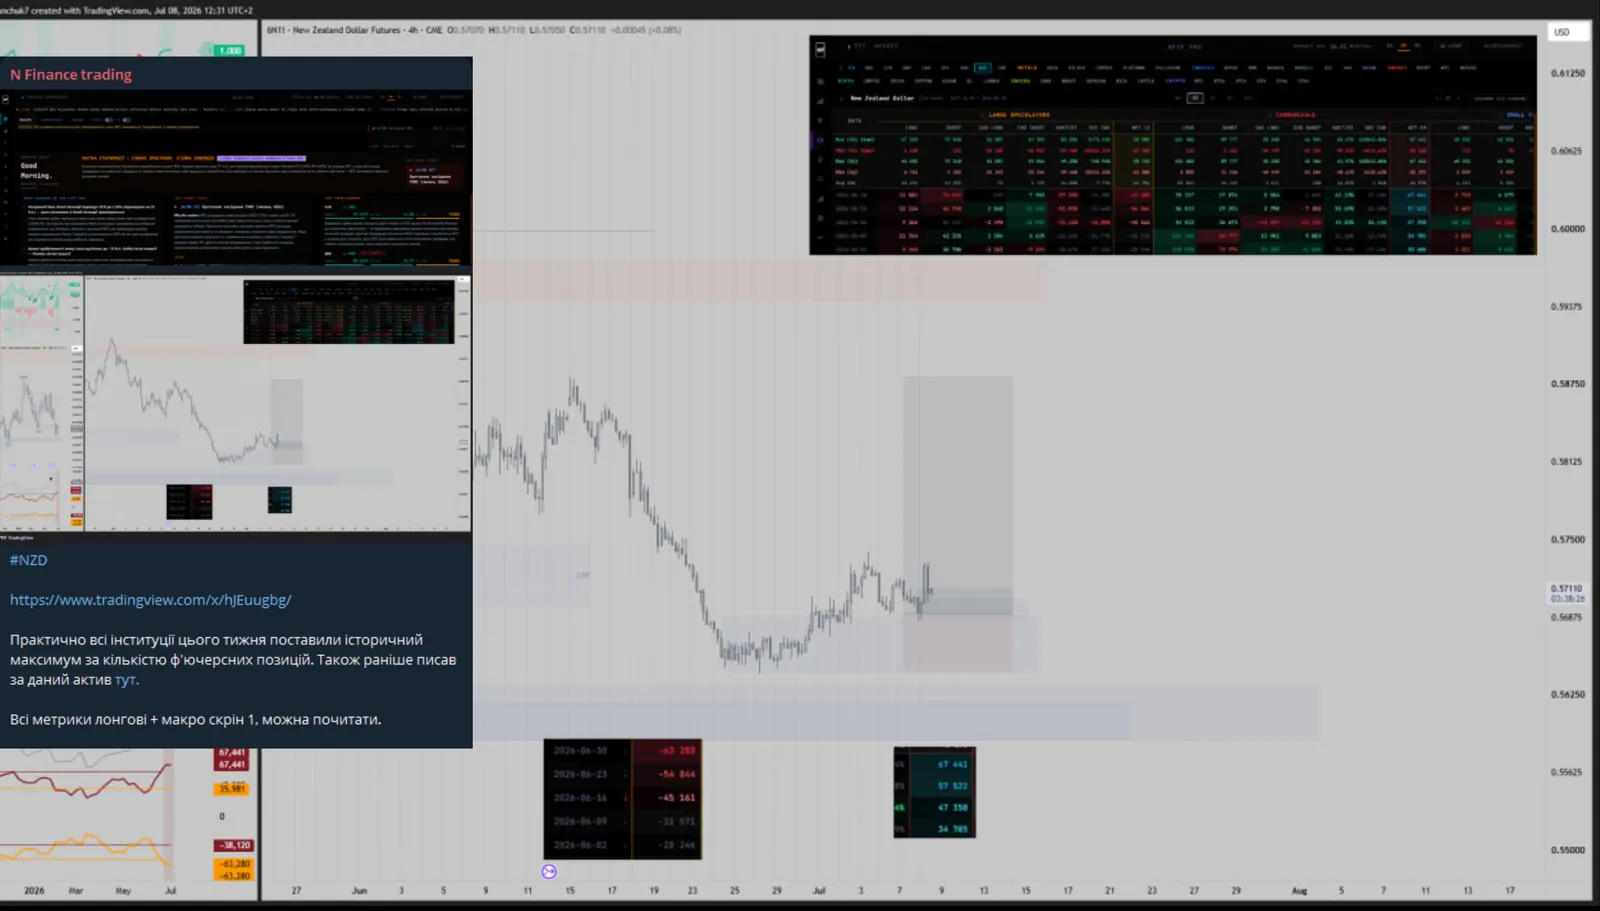
NZD — historic positioning extremes
2 photos
Course author photo
Nazar

course author

NZD — historic positioning extremes

Banks — more longs than in 99% of history. Funds — more shorts than in 98%. An all-time high in positions.

View the breakdown

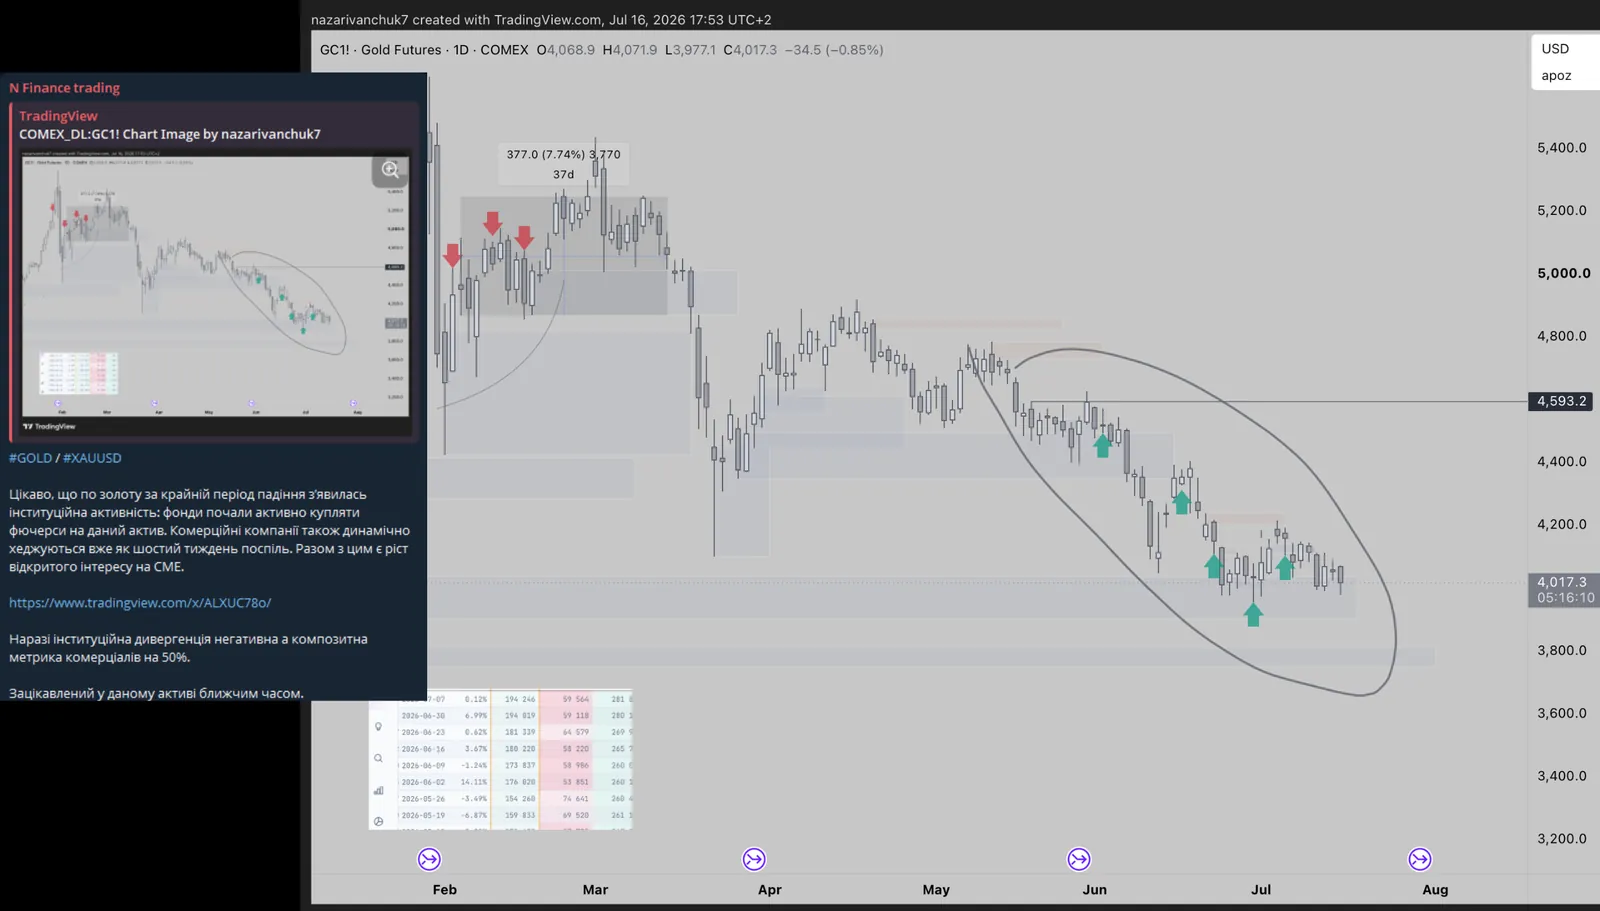
Gold — institutional activity on the price decline
2 photos
Course author photo
Nazar

course author

Gold — institutional activity on the price decline

During the decline funds began actively buying futures, commercials have been hedging for a sixth week.

View the breakdown

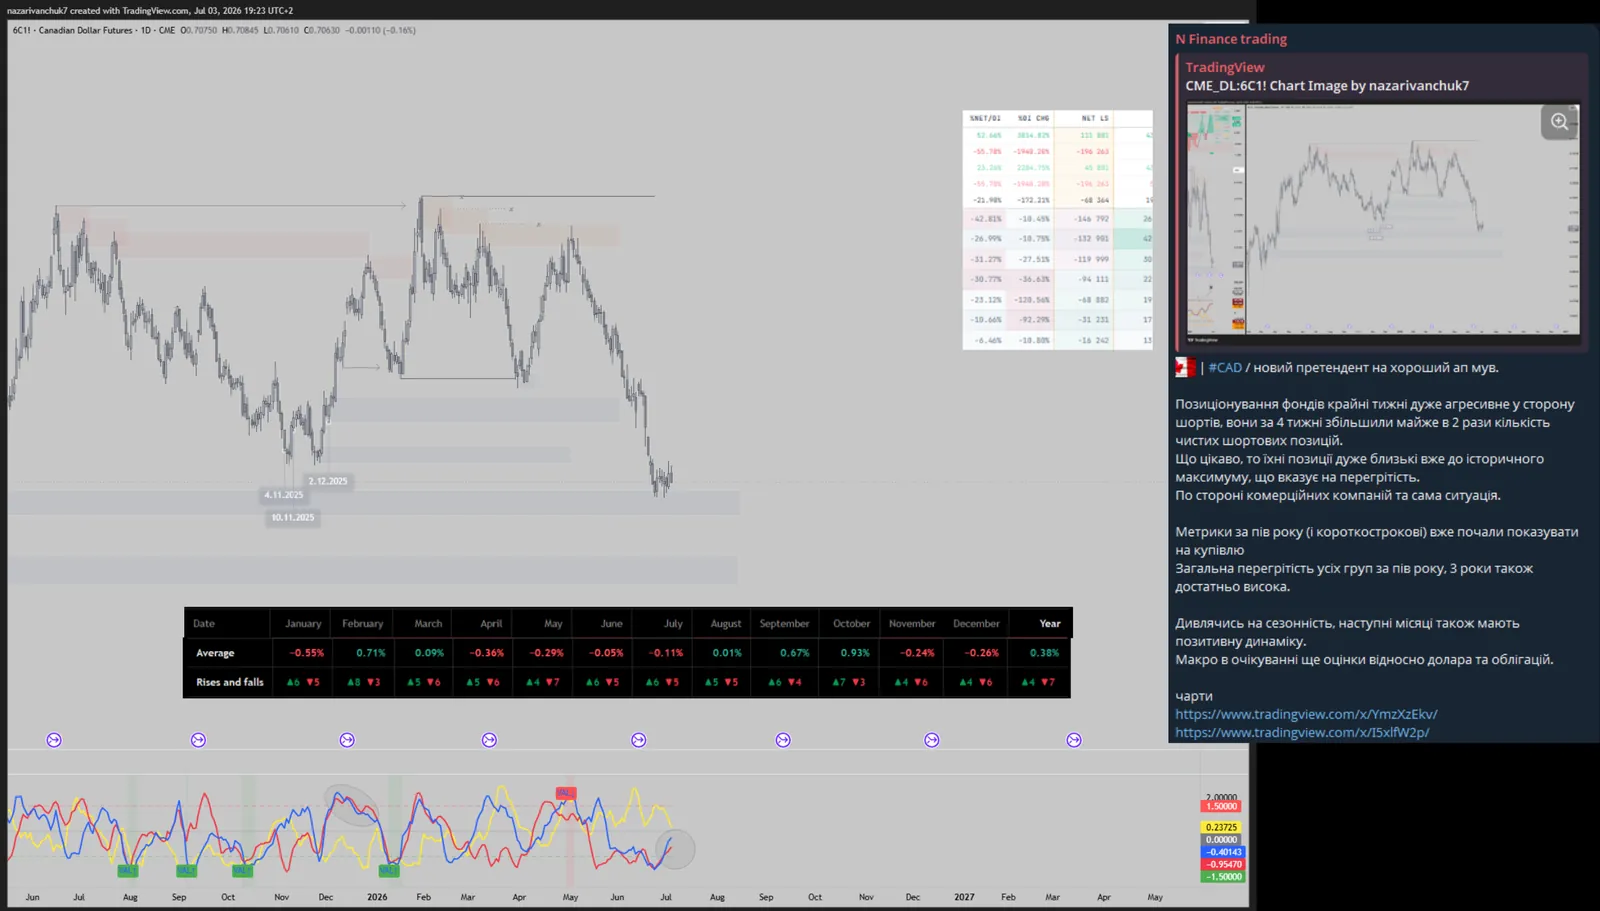
CAD — aggressive fund shorts near the high
3 photos
Course author photo
Nazar

course author

CAD — aggressive fund shorts near the high

Over 4 weeks funds nearly doubled their net shorts and approached the all-time high.

View the breakdown

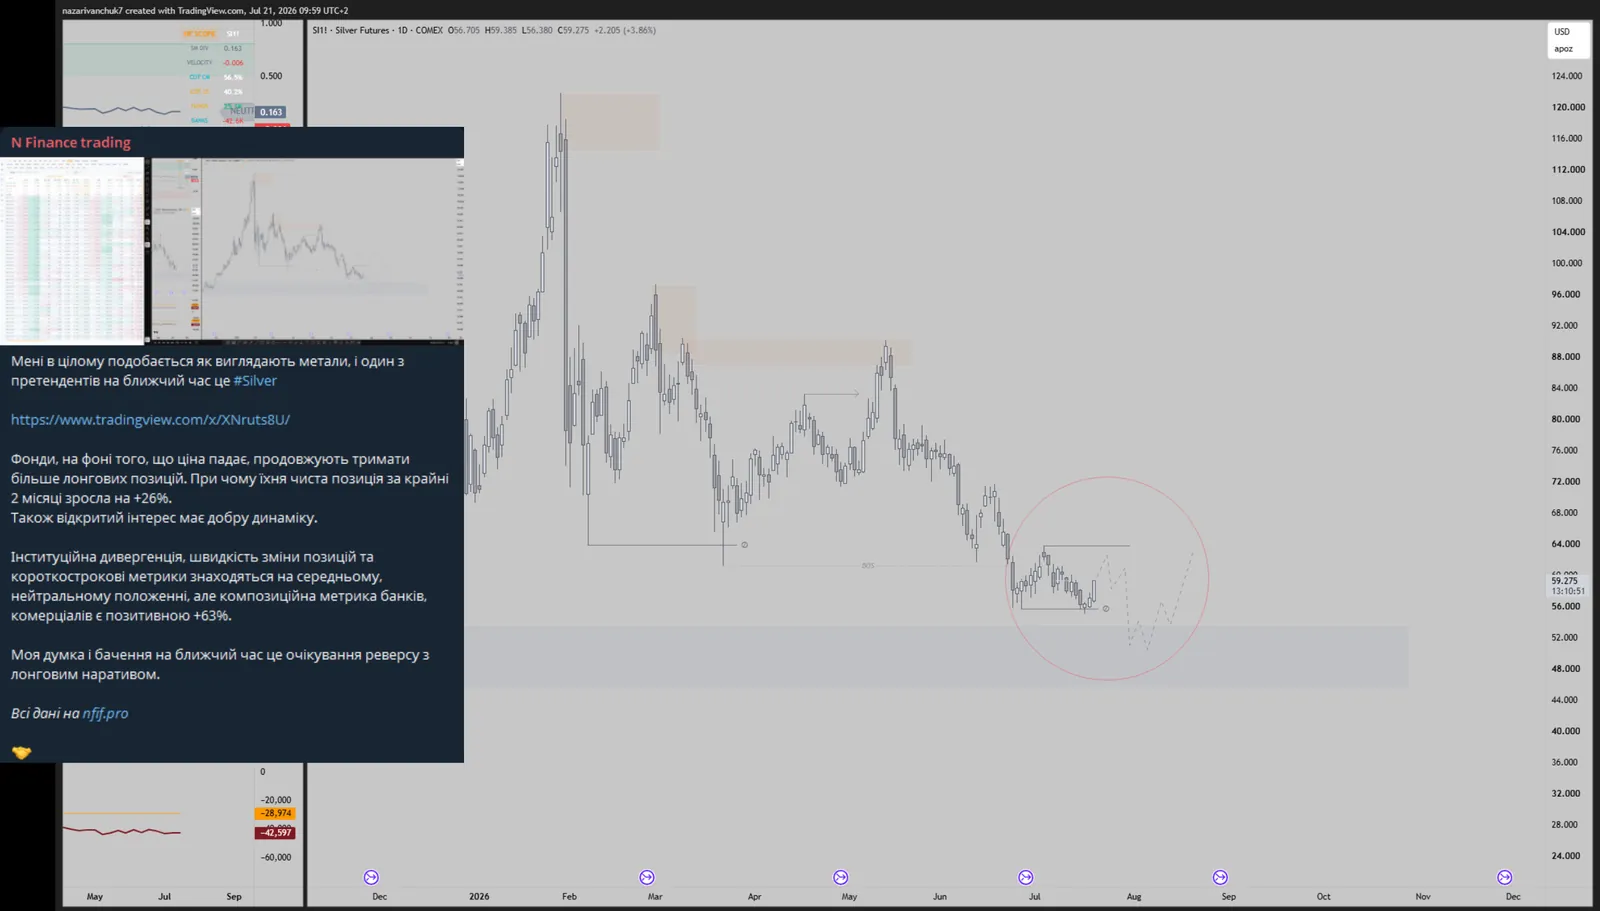
Silver — funds hold longs against the falling price
2 photos
Course author photo
Nazar

course author

Silver — funds hold longs against the falling price

The price is falling, but funds are building their net long position (+26% over 2 months). The banks' metric is +63%.

View the breakdown

small arrow icon

Choose a plan –

see the market through the eyes of institutions

Junior

COT basics and working with institutional data

$399

$6.65 / day

Choose
check icon

2 months of access to the COT reports training materials

check icon

2 months of access to the Discord server

check icon

30 days of access to the NFIF.pro platform

check icon

Ongoing support and help

check icon

Analysis: potential positions, trade ideas + full management

check icon

2 months of access to the proprietary indicators

small cross icon

Step-by-step instructions for building working files with metrics

small cross icon

Ready-made working files with all the metrics

small cross icon

Homework after every lesson

small cross icon

Historical data in a ready-made format

small cross icon

Q&A session | Personal call with Nazar

small cross icon

Access to 60+ lessons on the Supply&Demand concept

Pro

Full access, ready-made files and personal guidance

$1199

$3.28 / day

Choose

check icon

12 months of access to the COT reports training materials

check icon

12 months of access to the Discord server

check icon

90 days of access to the NFIF.pro platform + a lifetime -40% discount

check icon

Ongoing support and help

check icon

Analysis: potential positions, trade ideas + full management

check icon

12 months of access to the proprietary indicators

check icon

Step-by-step instructions for building working files with metrics

check icon

Ready-made working files with all the metrics

check icon

Homework after every lesson

check icon

40 years of historical data

check icon

Q&A session | Personal call with Nazar

check icon

Access to 60+ lessons on the Supply&Demand concept

Middle

Homework, practice and structural connection

$699

$5.83 / day

Choose
check icon

4 months of access to the COT reports training materials

check icon

4 months of access to the Discord server

check icon

45 days of access to the NFIF.pro platform + a lifetime -20% discount

check icon

Ongoing support and help

check icon

Analysis: potential positions, trade ideas + full management

check icon

4 months of access to the proprietary indicators

check icon

Step-by-step instructions for building working files with metrics

check icon

Homework after every lesson

check icon

18 years of historical data

small cross icon

Ready-made working files with all the metrics

small cross icon

Q&A session | Personal call with Nazar

small cross icon

Access to 60+ lessons on the Supply&Demand concept

Junior

COT basics and working with institutional data

$399

$199.5 / month

Choose
check icon

2 months of access to the COT reports training materials

check icon

2 months of access to the Discord server

check icon

30 days of access to the NFIF.pro platform

check icon

Ongoing support and help

check icon

Analysis: potential positions, trade ideas + full management

check icon

2 months of access to the proprietary indicators

small cross icon

Step-by-step instructions for building working files with metrics

small cross icon

Ready-made working files with all the metrics

small cross icon

Homework after every lesson

small cross icon

Historical data in a ready-made format

small cross icon

Q&A session | Personal call with Nazar

small cross icon

Access to 60+ lessons on the Supply&Demand concept

Pro

Full access, analytics and personal guidance

$1199

$99.91 / month

Choose

check icon

12 months of access to the COT reports training materials

check icon

12 months of access to the Discord server

check icon

90 days of access to the NFIF.pro platform + a lifetime -40% discount

check icon

Ongoing support and help

check icon

Analysis: potential positions, trade ideas + full management

check icon

12 months of access to the proprietary indicators

check icon

Step-by-step instructions for building working files with metrics

check icon

Ready-made working files with all the metrics

check icon

Homework after every lesson

check icon

40 years of historical data

check icon

Q&A session | Personal call with Nazar

check icon

Access to 60+ lessons on the Supply&Demand concept

Middle

Ready-made files, practice and structural connection

$699

$167.25 / month

Choose
check icon

4 months of access to the COT reports training materials

check icon

4 months of access to the Discord server

check icon

45 days of access to the NFIF.pro platform + a lifetime -20% discount

check icon

Ongoing support and help

check icon

Analysis: potential positions, trade ideas + full management

check icon

4 months of access to the proprietary indicators

check icon

Step-by-step instructions for building working files with metrics

check icon

Homework after every lesson

check icon

18 years of historical data

small cross icon

Ready-made working files with all the metrics

small cross icon

Q&A session | Personal call with Nazar

small cross icon

Access to 60+ lessons on the Supply&Demand concept

vector decorative shape
Course author photo

Course author

Nazarii Ivanchuk

Supply&Demand trading concept | COT & Macro | Intraday & Swing

Multi-Assets: FX, EU/US Indices, Commodities, Metals, Crypto

7+

Years of work experience

European companies

Experience completing and working with European offline
prop firms

Global Custody&PM Bank

Experience working at one of the world's largest financial institutions for the custody and management of investments

Managed capital

Working with managed capital in a discretionary-management format, with a focus on exposure control and risk management.

Frequently asked questions

and answers

Is this approach suitable for a beginner?

Yes, depending on the plan there is also an option to get access to the concept I trade in combination with the COT reports, where there is a clear learning order: the basics, the fundamentals → structure → metrics → interpretation → lots of practice → reinforcement with homework → ongoing support and help along the way. You get the chance to master everything you need from scratch to full-fledged work in the financial markets.

What exactly will I get after the course?

This is an opportunity to gain very strong fundamental knowledge that will significantly strengthen your current approach to the financial markets. The course includes a full step-by-step instruction for building custom working files that collect and aggregate the reports into a format convenient for analysis with various metrics. On top of that, only practical lessons on how to read and apply everything in your work. In the end you get complete knowledge that can already be applied in practice.

Which strategy/concept does this approach work with?

The reports give an understanding of the overall narrative by assessing institutions' positioning, which lets you combine it with any style or approach and not be limited to trading alone. This method of analysis is actively used by portfolio managers, investors, analysts and other professional market participants to gain a deeper understanding of market sentiment and potential trend changes.

Which markets does this work on?

Today the reports cover almost all the main futures markets – from raw commodities (grain, oil, gold, etc.) to financial instruments. In particular: the entire currency market (FOREX), stock indices, metals, bonds, energy, grains, interest rates, livestock, softs and cryptocurrencies (BTC, ETH and some alts).

Why are these companies required to report?

In the US there is a rule: every large trader who exceeds a certain futures position threshold is required to report their positions to the CFTC.

For example, if a hedge fund or company holds more than a defined number of contracts on oil or gold, they have to submit data on their longs and shorts to the regulator. The CFTC collects this data from exchanges and traders every week (traders file electronic reports on their positions every Tuesday), verifies it, and on Friday publishes a consolidated public report.

Didn't find an answer to your question?